

Supply planning is managing the inventory produced by manufacturing to fulfil the requirements created from the demand plan.
How many pallets do we need to ship to the DC1 for the next month?
Your target is to balance supply and demand to ensure the best service level at the lowest cost.
Can we optimize this this process with data analytics?
In this case study, we will present introduce a simple methodology to usedata analytics to answer a complex Supply Planning Problem considering:
- Inbound Transportation Costs from the Plants to the Distribution Centers (DC) ($/Carton)
- Outbound Transportation Costs from the DCs to the final customer ($/Carton)
- Customer Demand (Carton)
Supply Planning Problem
You support the supply planning manager of a mid-size manufacturing company, you received feedback that the distribution costs are too high.
Based on the analysis of the Transportation Manager, this is mainly due to the stock allocation rules.
What is the root cause?
Sometimes, your customers are not shipped from the closest distribution centre, which impacts your freight costs.
Let’s understand why!
Your Distribution Network
- 2 plants producing products with infinite capacity
Note: We’ll see later how we can improve this assumption easily - 2 distribution centres that receive finished goods from the two plants and deliver them to the final customers
Note: We will consider that these warehouses operate X-Docking to avoid considering the concept of stock capacity in our model - 200 stores (delivery points)
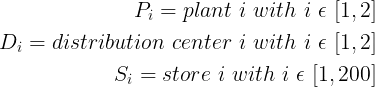
To simplify the comprehension, let’s introduce some notations
What drives the demand?
Store Demand

How much does it cost to move goods?
Transportation Costs
Our main goal is to reduce the total transportation costs, including inbound shipments (from the plants to the DCs) and outbound shipments (from the DCs to the stores).


Question
Which Plant i and Distribution n should I chose to produce and deliver 100 units to Store p at the lowest cost?
Comment
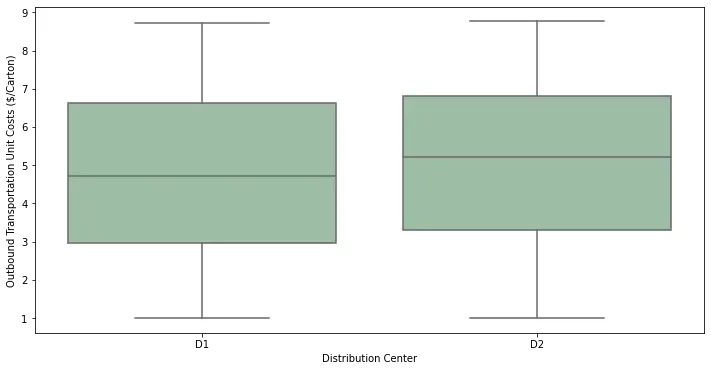
The box plot above shows that the D1 distribution of Unit Cost has a median value lower than D2.
What’s the impact?
Therefore, we expect the model to direct a significant part of the flow through D1.
Let’s explore that in detail in the next section.
Solve the model and prepare the results
What are the results of your simulation?
The model takes the cheapest route for Inbound by linking P2 with D1 (resp. P1 with D2).
As expected, over 90% of the outbound flow goes through D1 to minimize Outbound Costs.
163 stores are delivered by D1
0 store is delivered by the two warehouses together
Conclusion
Using linear programming with Python can help supply planning managers optimize their distribution network and reduce transportation costs.
We can quickly adapt the model if we change the conditions and constraints.
The model presented here can be easily improved by adding operational constraints:
- Production Costs in Plants ($/Case)
- Maximal X-Docking Capacity in Distribution Centers (Cartons)
But also by improving the cost structure by adding
- Fixed/Variable Costs Structures in Distribution Centers ($)
- Fixed + Variable Transportation Costs Structure y = (Ax +b)
The only limit you will find is the linearity of the constraints and the objective functions.